Japan Gold Announces High-Grade Results from the Barrick Alliance - Togi Project
Vancouver, British Columbia--(Newsfile Corp. - April 22, 2021) - Japan Gold Corp. (TSXV:JG) (OTCQB: JGLDF) (the "Company") is pleased to announce high-grade gold assays from surface sampling at its Barrick Alliance, Togi Project, on the Noto Peninsula of Honshu Island (Figure 1).
Togi Project Result Highlights:
- 412 rock samples were collected from outcrop, float, and mine waste dumps:
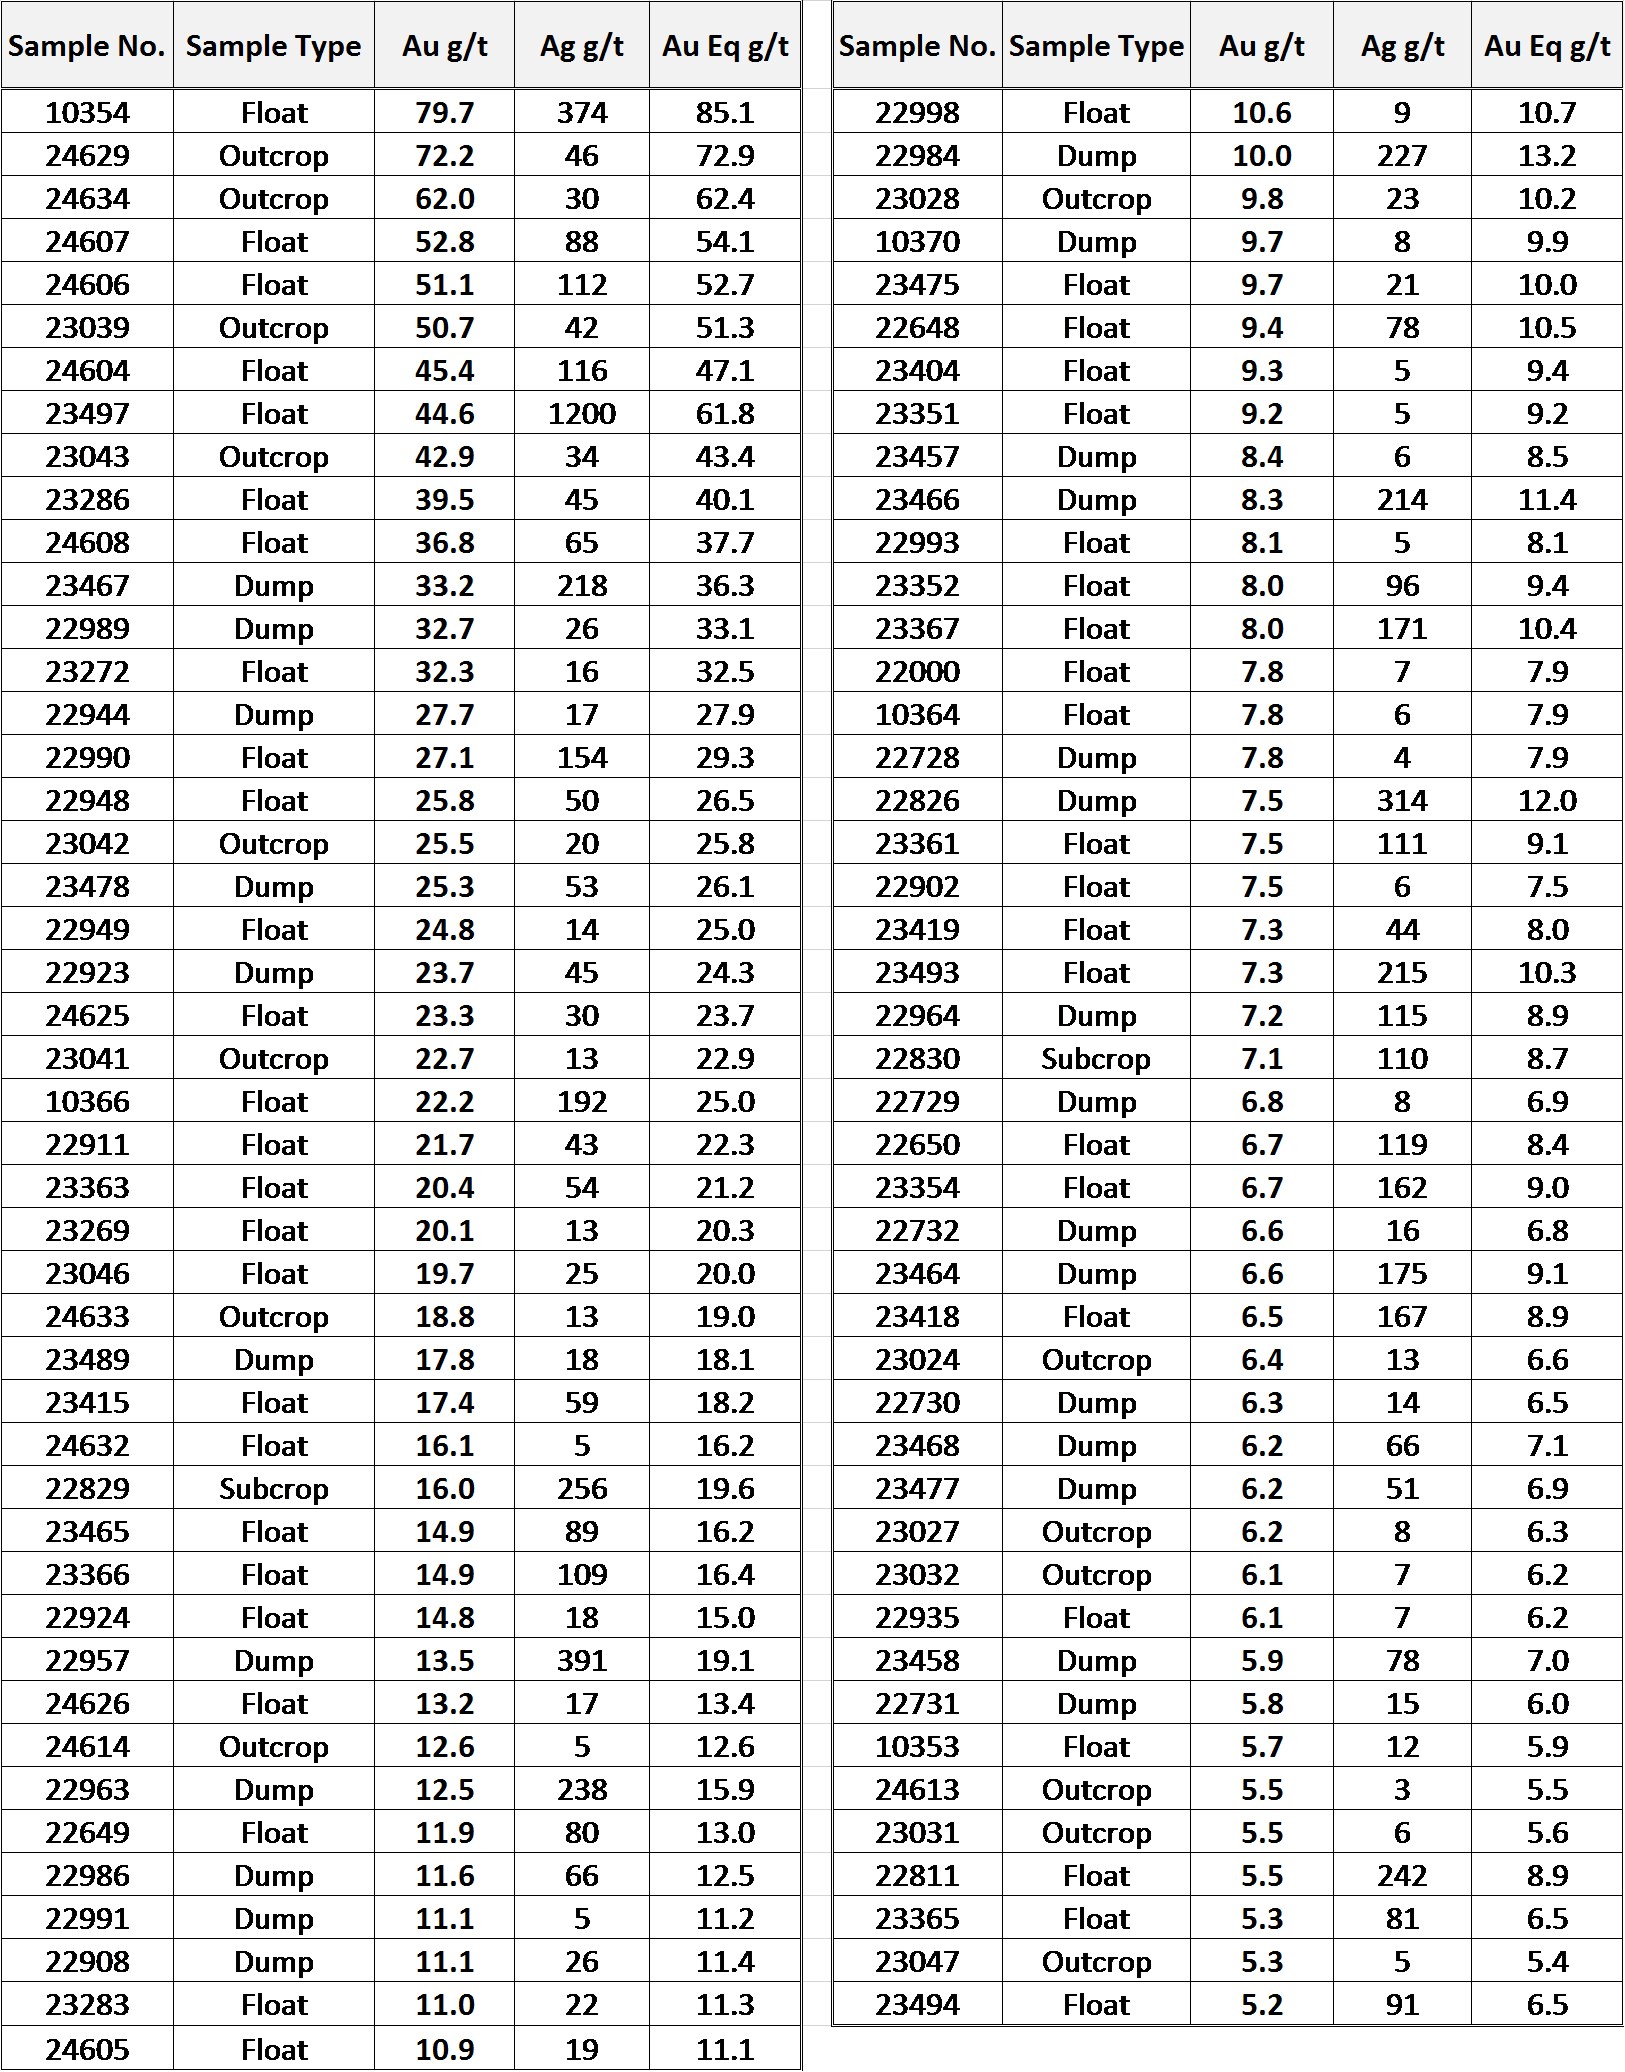
- 235 samples assayed gold greater than 0.5 g/t Au, with 91 assaying greater than 5 g/t Au (Table 1):
- including 64 samples assaying 5 g/t Au - 20 g/t Au
- including 27 samples assaying greater than 20 g/t Au,
with a peak value of 79.7 g/t Au
- 235 samples assayed gold greater than 0.5 g/t Au, with 91 assaying greater than 5 g/t Au (Table 1):
- Highly anomalous gold in bulk leach extractable gold analysis (BLEG), from stream-sediment sampling, has defined a continuous 8 km-long corridor
"The Barrick Alliance positive assay results across the Togi Project, which includes the Togi Goldfield, highlight another underexplored epithermal district in Japan. The high-grade rock samples and extensive positive BLEG results reinforce the potential of the area and our belief that there are major gold discoveries still to be made in Japan", commented John Proust, Chairman & CEO.
Togi Project
The 3,990-hectare Togi Project is located on the northern flank of a regional graben and hosted in early Miocene andesite volcanics under-lain by a northeast trending gravity anomaly. A similar geological and structural setting is noted 160 kilometres along strike to the northeast on Sado Island, which hosted Japan's second largest gold mine, the Sado Mine with production of 2.5 million ounces of gold and 74 million ounces of silver2 prior to its closure in 1974 (Figure 1).
Gold mineralization was discovered in the Togi area in 1896 and historic records from the Togi Goldfield report seven separate areas of workings along a 7 km trend which produced a combined 48,000 oz of gold and 180,000 oz of silver between 1910-21. Deposits mined in the project area are divided into the Hirochi deposits in the northeast and Urugami deposits in the southwest (Figure 2). The Mori vein from within the Hirochi group produced 16,500 oz of gold at an average grade of 14 g/t Au. The vein is reported to be up to 4 m wide, with gold values ranging between 8 g/t Au and 20 g/t Au1. Records show the mineralization at lower mine levels open at depth with average grades of 8.12 g/t Au and 56.9 g/t Ag1, workings did not exceed 120 m below portal level.
In the southwest of the goldfield, historic mine workings on the Urugami deposits cover over 30 small veins and stockwork zones within a 4 square km zone. The Togo Mine, the largest within the Urugami area, produced over 18,000 oz of gold and 83,000 oz of silver from stockwork vein and breccia zones1,3. Sinter mapped at Urugami and the narrower stock-work style of quartz vein mineralization indicate the top of a hot-spring epithermal system is preserved, thus supporting the potential for deeper boiling-zone vein targets. For more information on the Togi Project refer to the Company's news release dated July 18, 2019.
Barrick Alliance Geochemical Sampling of the Togi Project
During November 2020, the Barrick Alliance collected 412 rock samples and 88 BLEG samples across the Togi Project. Systematic stream sediment sampling has defined a continuous northeast trending, 8 km long corridor of gold anomalous drainages within the Togi Project (Figure 2). Gold and pathfinder element anomalism within the corridor are defined by BLEG samples assaying greater than 15 ppb Au, with a peak result from a sample in the Urugami Prospect returning an assay of 2,152 ppb Au.
During the BLEG sampling programme Japan Gold geologists collected quartz vein and silicified rock samples from vein outcrops, float, and from historic mine waste-dumps around the Urugami and Hirochi Prospects (Figure 2).
The Urugami Prospect
At the Urugami Prospect, an approximate 4 square km alteration zone hosts 30 separate high-level epithermal vein zones and silica sinter sub-crops (Plate 4), 110 of 215 rock samples collected here gave results greater than 1 g/t Au. High-grade results from selective-grab samples of outcropping vein zones up to 1.5 m wide include:
72.2 g/t Au and 46 g/t Ag
62.0 g/t Au and 30 g/t Ag
50.7 g/t Au and 42 g/t Ag
42.9 g/t Au and 34 g/t Ag
Rock float and mine dump samples gave a similar tenor of gold with 39 samples assaying greater than 5 g/t Au, peak results include:
52.8 g/t Au and 88 g/t Ag
51.1 g/t Au and 112 g/t Ag
45.4 g/t Au and 116 g/t Ag
Refer to Table 1 for significant Au, Ag and Gold Equivalent results, and to Plates 1 to 4 for examples of quartz vein and sinter samples collected.
The Hirochi Prospect
At the Hirochi Prospect, a series of workings developed along a 2.2 km northeast trending zone hosting multiple parallel quartz veins, 86 of the 185 samples collected here gave results greater than 1 g/t Au. Thirty-eight samples gave Au results greater than 5 g/ t Au with peak results from float and mine dump samples including:
79.7 g/t Au and 374 g/t Ag
44.6 g/t Au and 1,200 g/t Ag
33.2 g/t Au and 218 g/t Ag
22.2 g/t Au and 192 g/t Ag
Selective grab samples of vein outcrops up to 1 m wide at the Hirochi Prospect returned up to 7.1 g/t Au and 110 g/t Ag, and a chip-channel sample from a 1 m wide vein gave 3.5 g/t Au and 6.6 g/t Ag, refer to Plates 5 to 8 for examples of quartz vein material collected at the Hirochi Prospect.
Areas of intense clay alteration seen between the Hirochi Prospect and Urugami Prospect suggest continuity of the hydrothermal system between the two prospects. Continuity of the system is strongly supported by the contiguous nature of gold in BLEG anomalism along the 8 km long alteration corridor, further emphasizing exploration potential.
References
1 Gold Mines of Japan, 1989. The Mining & Materials Processing Institute of Japan
2 Garwin et al. 2005. Tectonic setting, Geology, and gold and copper mineralization in the Cenozoic magmatic arcs of Southeast Asia and the West Pacific. Economic Geology 100th Anniversary Vol. pp 891-930
3 Austpac Gold NL., 1988-94. Company Annual Reports
Sampling Techniques and Assaying
Rock results presented in this news release and accompanying figures are from 1-3 kg selected grab and semi-continuous chip-channel outcrop, and selected grab of float and historic mine waste dump samples. The grab samples of float material reported in this announcement are believed to originate from the underlying bedrock of the drainage basin from which they were collected. The Company cautions that grab and float samples are selective by nature and may not be representative of typical mineralization on the property. Sample preparation and assaying were done by ALS Vancouver, BC, Canada. Samples were crushed and pulverised and gold was analysed by 50 gram-charge Fire Assay and AAS finish. A 48 multielement analysis including silver was done by four-acid digest and ICP-MS determination.
A Chain-of-Custody was established between the Company and receiving laboratory to ensure the integrity of the samples during transportation from site to the lab.
Certified Reference Materials (CRMs) were inserted by Japan Gold at every 20th sample to assess repeatability and assaying precision of the laboratory. In addition, the laboratory applied its own internal Quality Control procedure that includes sample duplicates, blanks & geochemical standards. They report these results with the certified Assay Report. Laboratory procedures and QAQC protocols adopted are considered appropriate. The CRMs and internal QC-QA results fall within acceptable levels of accuracy & precision and are considered to lack any bias.
Qualified Person
The technical information in this news release has been reviewed and approved by Japan Gold's Vice President of Exploration, Andrew Rowe, BAppSc, FAusIMM, FSEG, who is a Qualified Person as defined by National Instrument 43-101.
On behalf of the Board of Japan Gold Corp.
"John Proust"
Chairman & CEO
About Japan Gold Corp.
Japan Gold Corp. is a Canadian mineral exploration company focused solely on gold exploration across the three largest islands of Japan: Hokkaido, Honshu and Kyushu. The Company has a country-wide alliance with Barrick Gold Corporation to jointly explore, develop and mine certain gold mineral properties and mining projects. The Company holds a portfolio of 31 gold projects which cover areas with known gold occurrences, a history of mining and are prospective for high-grade epithermal gold mineralization. Japan Gold's leadership team represent decades of resource industry and business experience, and the Company has recruited geologists, drillers and technical advisors with experience exploring and operating in Japan. More information is available at www.japangold.com or by email at This email address is being protected from spambots. You need JavaScript enabled to view it.
For further information, please contact:
John Proust
Chairman & CEO
Phone: 778-725-1491
Email: This email address is being protected from spambots. You need JavaScript enabled to view it.
Cautionary Note
Neither the TSX Venture Exchange nor its Regulation Services Provider (as such term is defined in the policies of the TSX Venture Exchange) accepts responsibility for the adequacy or accuracy of this release. This news release contains forward-looking statements relating to expected or anticipated future events and anticipated results related to future partnerships and the Company's 2020 gold exploration program. These statements are forward-looking in nature and, as a result, are subject to certain risks and uncertainties that include, but are not limited to, general economic, market and business conditions; competition for qualified staff; the regulatory process and actions; technical issues; new legislation; potential delays or changes in plans; working in a new political jurisdiction; results of exploration; the timing and granting of prospecting rights; the Company's ability to execute and implement future plans, arrange or conclude a joint-venture or partnership; and the occurrence of unexpected events. Actual results achieved may differ from the information provided herein and, consequently, readers are advised not to place undue reliance on forward-looking information. The forward-looking information contained herein speaks only as of the date of this News Release. The Company disclaims any intention or obligation to update or revise forward‐looking information or to explain any material difference between such and subsequent actual events, except as required by applicable laws.
Table 1: Significant rock samples greater than 5 g/t Gold
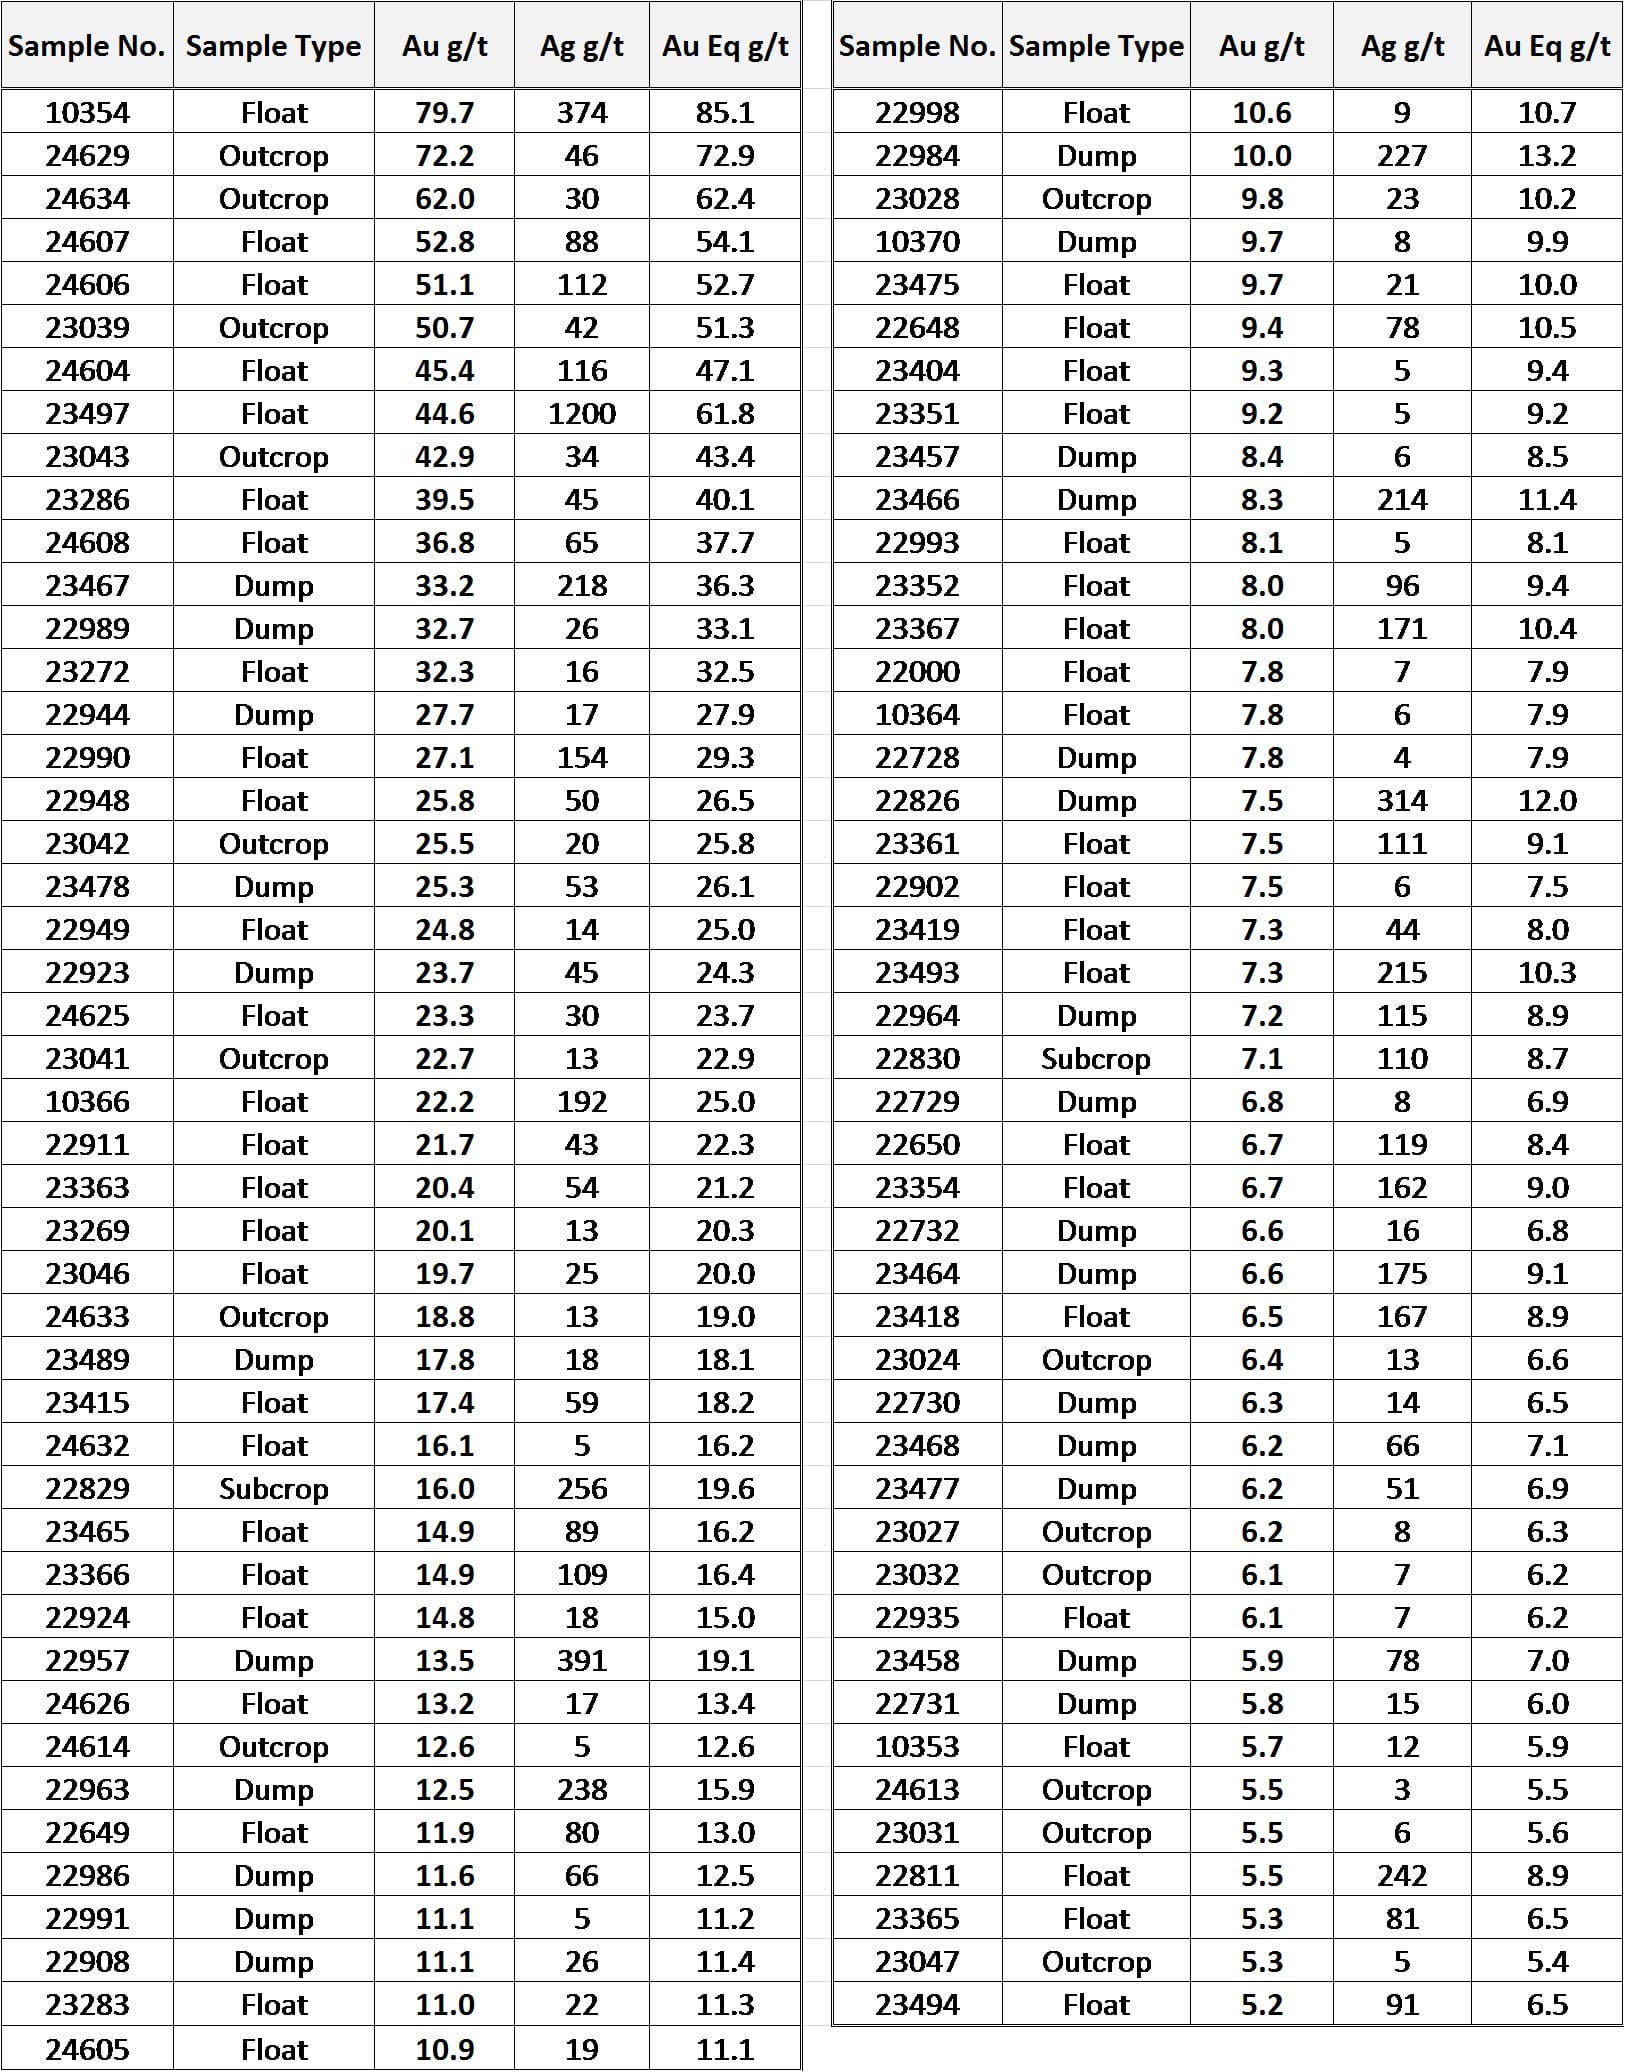
NB: Au Eq g/t is Gold Equivalent calculated using a gold price of USD$1,745 per ounce and a silver price of USD$25 per ounce
To view an enhanced version of Table 1, please visit:
https://orders.newsfilecorp.com/files/5665/81362_9aaa807b34203baf_001full.jpg
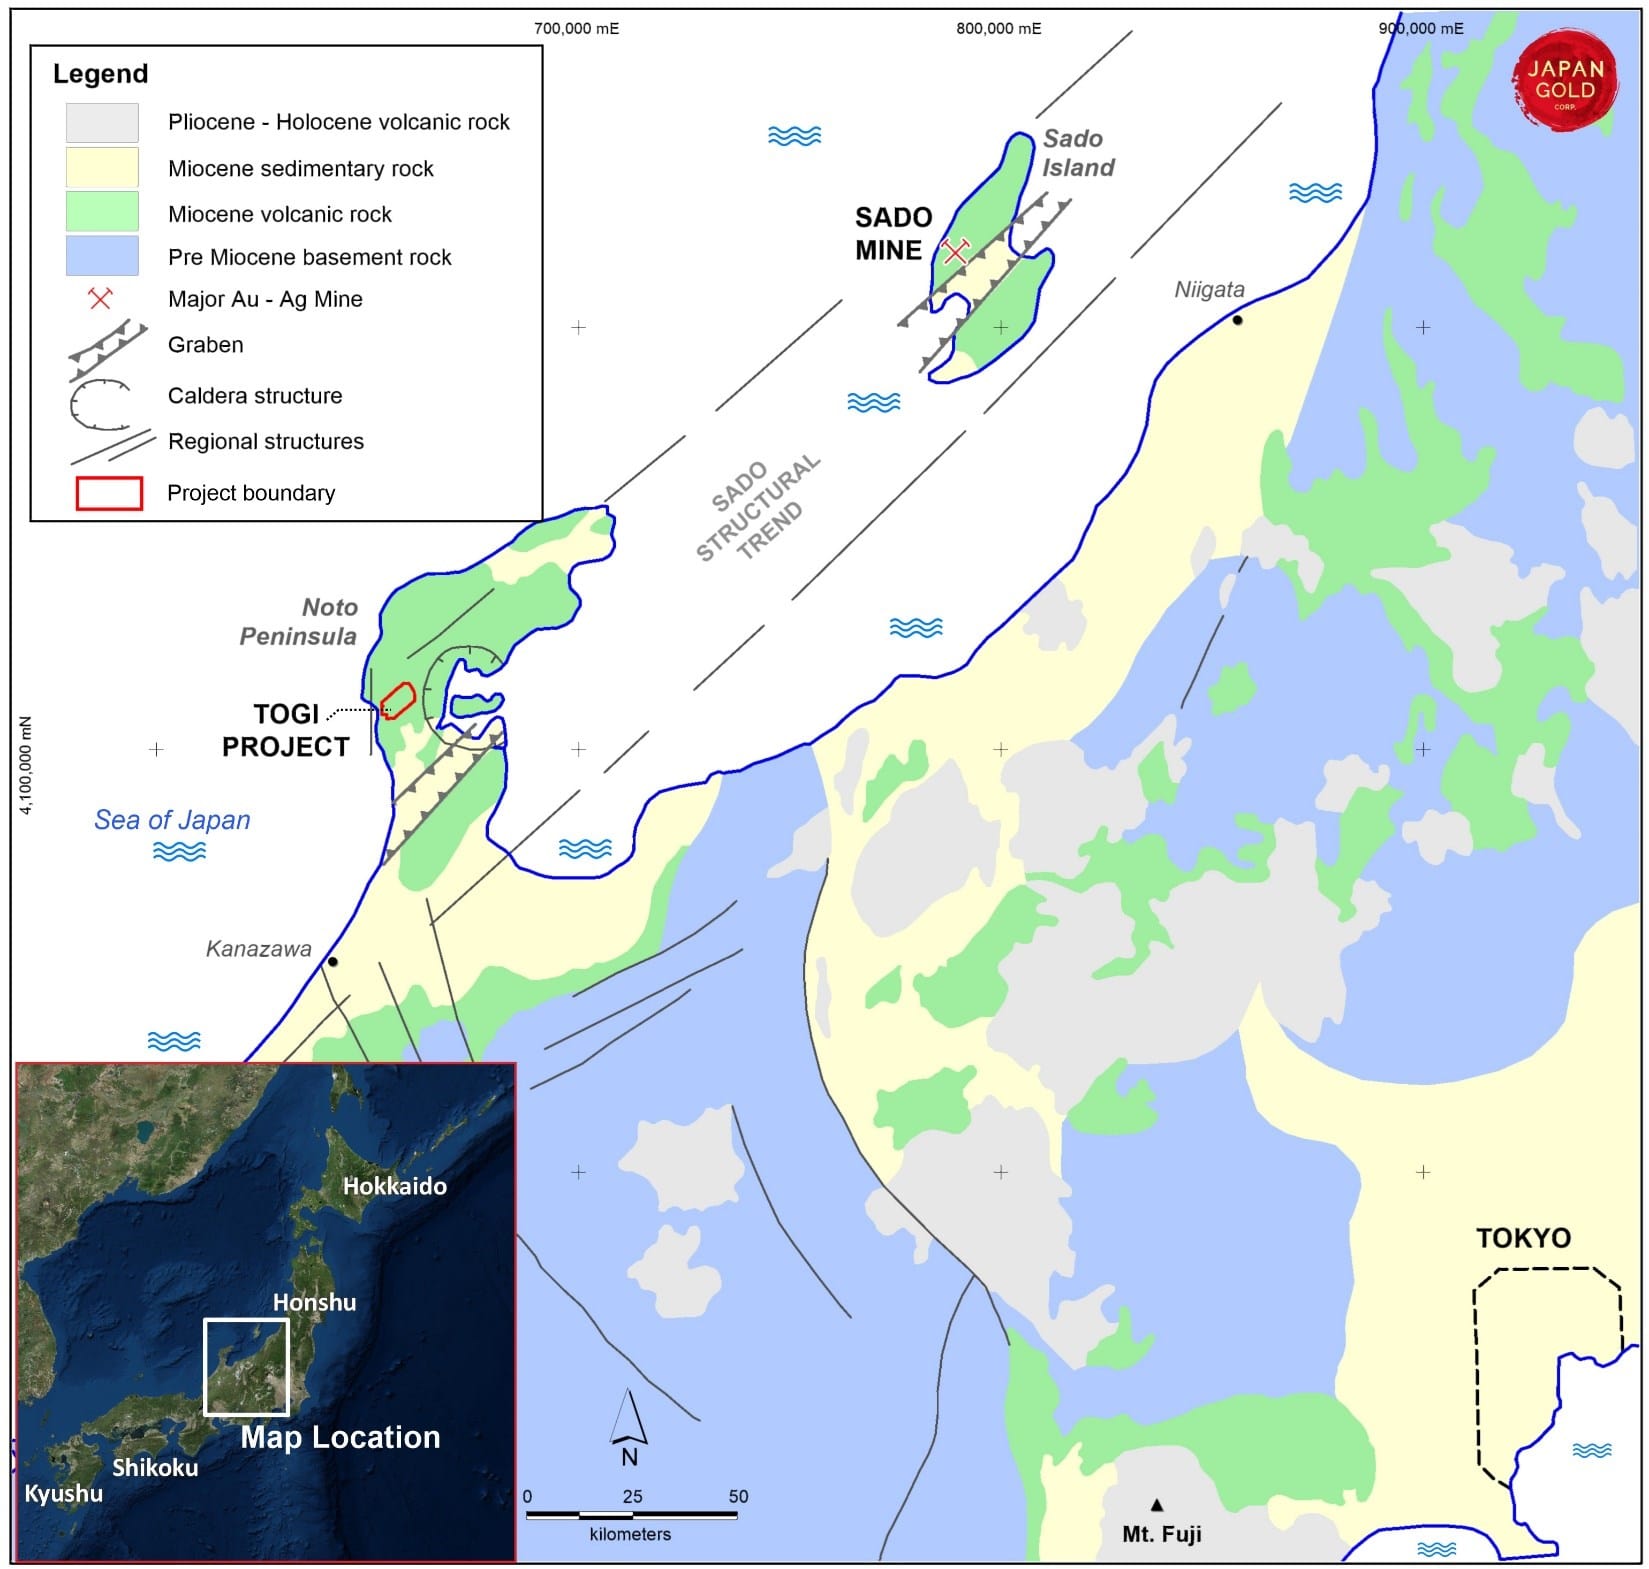
Figure 1: Barrick Alliance Togi Project on the Noto Peninsula, geological setting.
To view an enhanced version of Figure 1, please visit:
https://orders.newsfilecorp.com/files/5665/81362_9aaa807b34203baf_002full.jpg
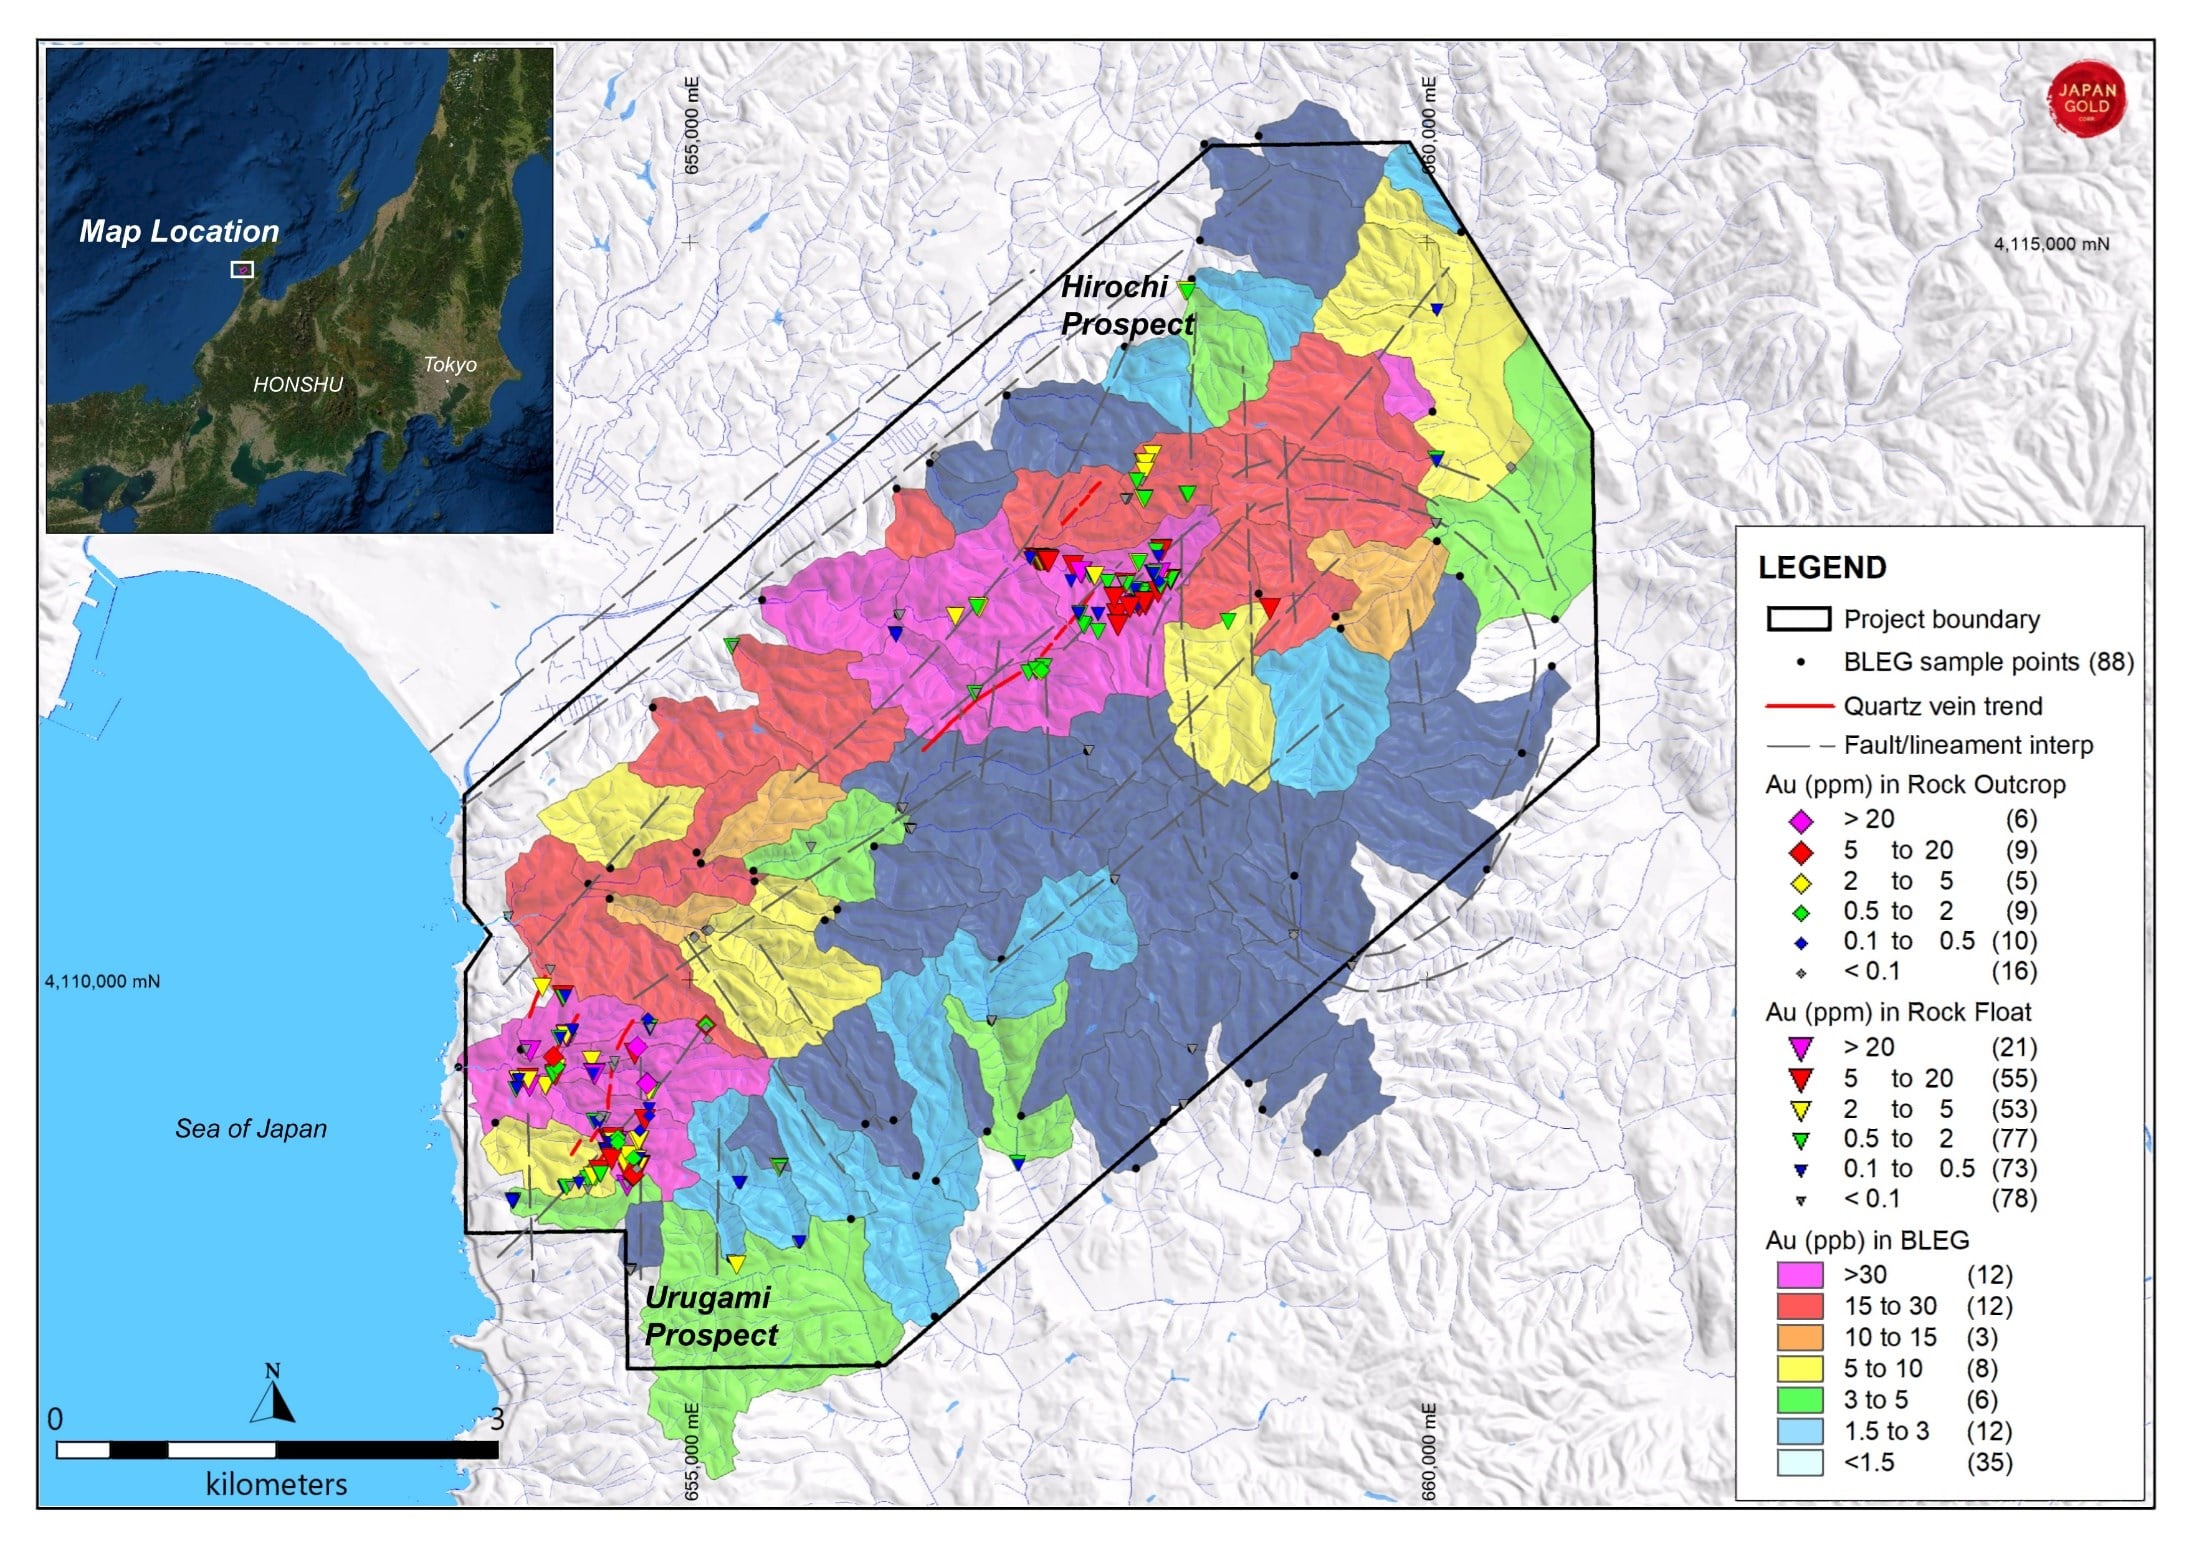
Figure 2: Togi Project, Gold in BLEG basin results and Gold in rock chip results.
To view an enhanced version of Figure 2, please visit:
https://orders.newsfilecorp.com/files/5665/81362_9aaa807b34203baf_003full.jpg

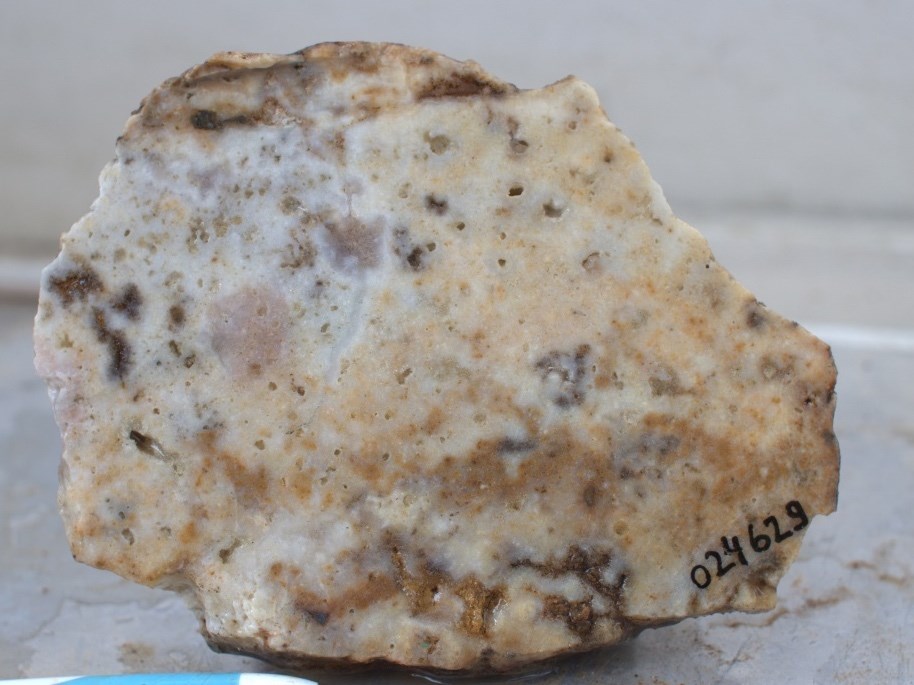
Plate 1: Urugami Prospect, outcrop grab sample 024629, brecciated chalcedony vein. Au 72.2 g/t & Ag 46.4 g/t
To view an enhanced version of this graphic, please visit:
https://orders.newsfilecorp.com/files/5665/81362_9aaa807b34203baf_006full.jpg

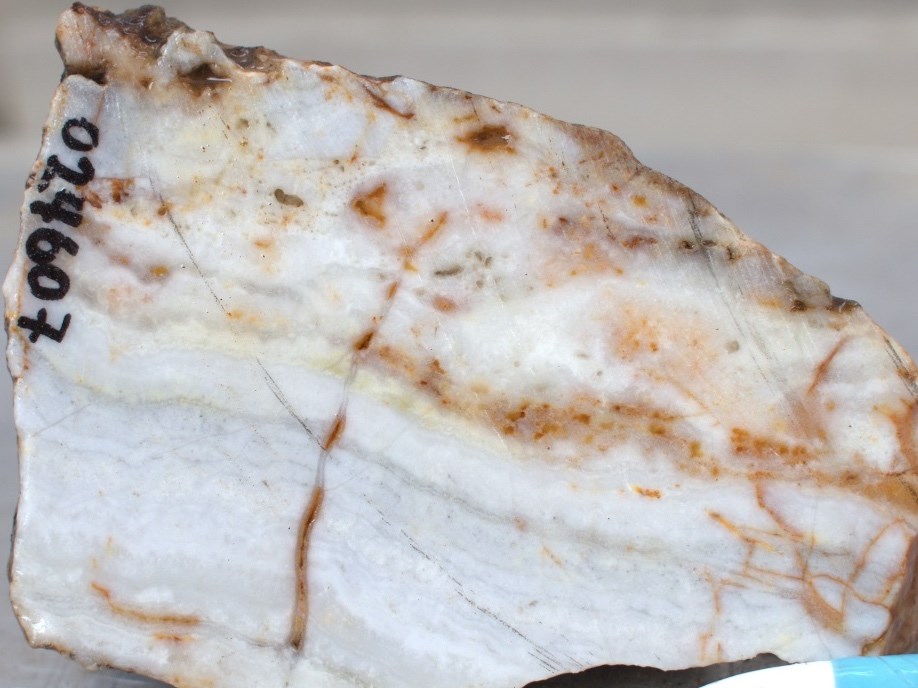
Plate 2: Urugami Prospect, float sample 024607, colloform-crustiform banded quartz vein. Au 52.8 g/t & Ag 88 g/t
To view an enhanced version of this graphic, please visit:
https://orders.newsfilecorp.com/files/5665/81362_9aaa807b34203baf_007full.jpg
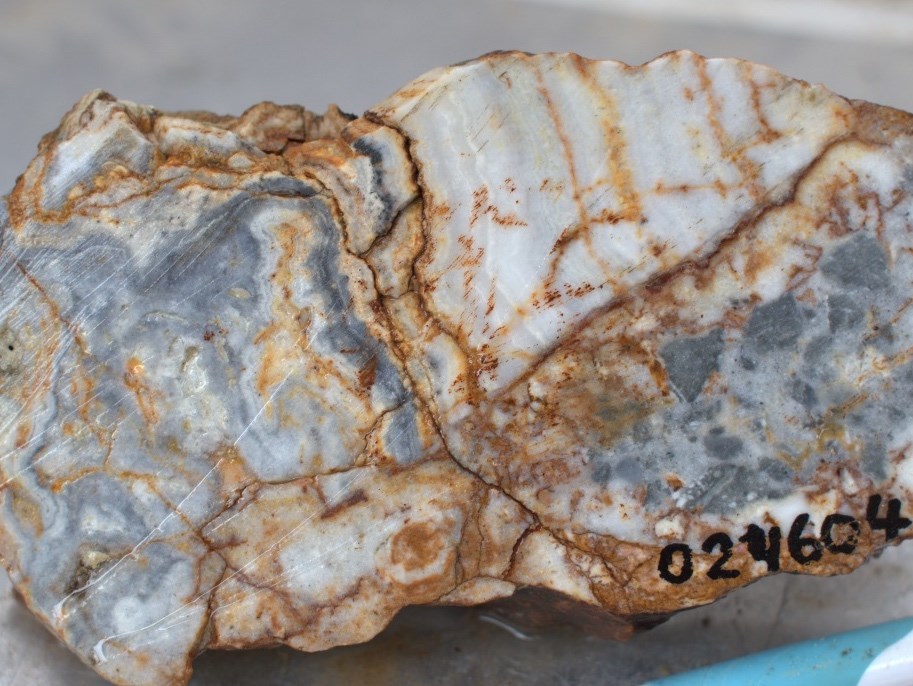
Plate 3: Urugami Prospect, float sample 024604, colloform-crustiform banded quartz vein. Au 45.4 g/t & Ag 116 g/t
To view an enhanced version of this graphic, please visit:
https://orders.newsfilecorp.com/files/5665/81362_9aaa807b34203baf_008full.jpg
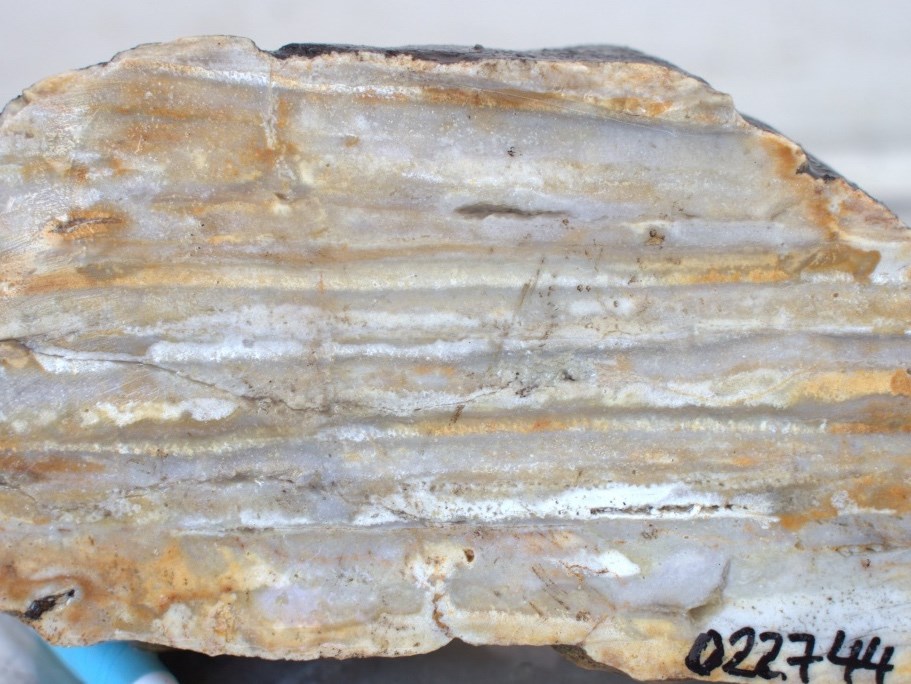
Plate 4: Urugami Prospect, float sample 022744, banded silica sinter. Au 0.05 g/t / Ag 0.24 g/t
To view an enhanced version of this graphic, please visit:
https://orders.newsfilecorp.com/files/5665/81362_9aaa807b34203baf_011full.jpg
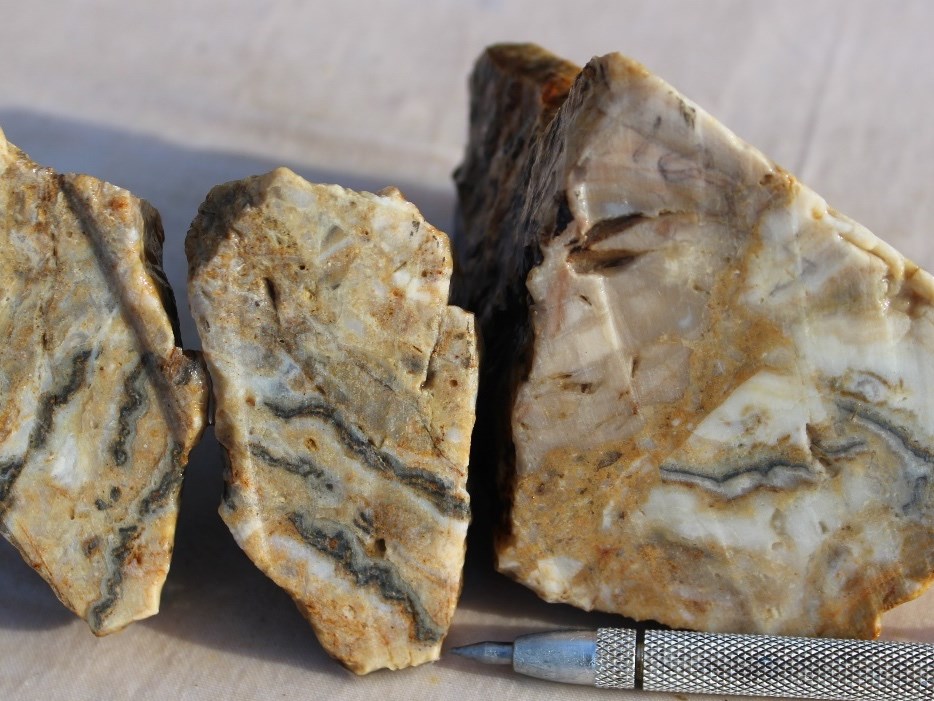
Plate 5: Hirochi Prospect, float sample 023415, Ginguro banded quartz vein. Au 79.7 g/t & Ag 374 g/t
To view an enhanced version of this graphic, please visit:
https://orders.newsfilecorp.com/files/5665/81362_9aaa807b34203baf_014full.jpg
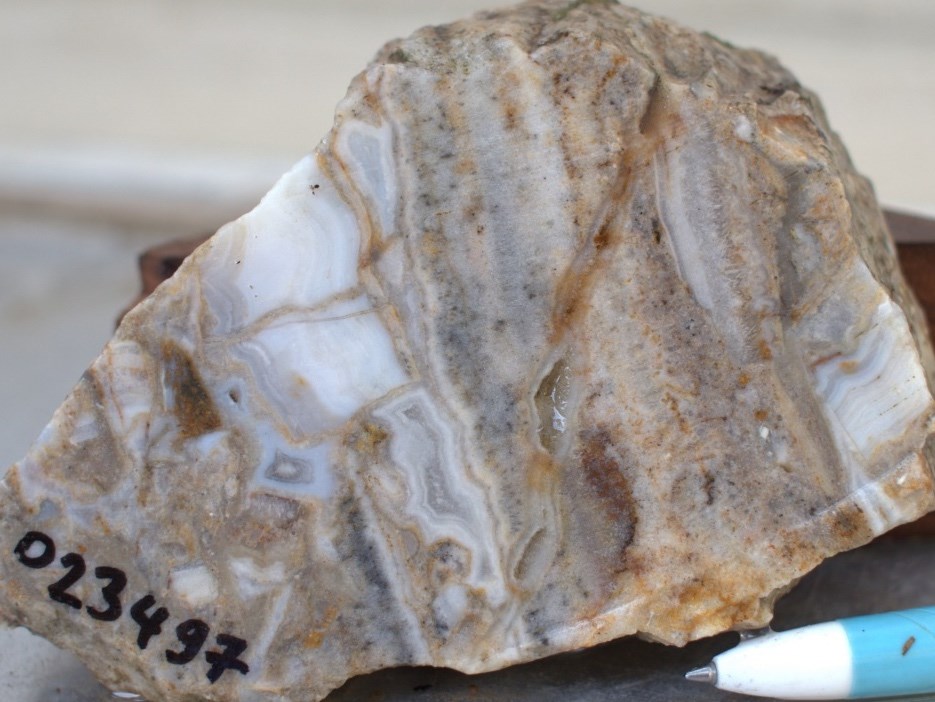
Plate 6: Hirochi Prospect, float sample 023497, Colloform-crustiform banded quartz vein. Au 44.6 g/t & Ag 1,200 g/t
To view an enhanced version of this graphic, please visit:
https://orders.newsfilecorp.com/files/5665/81362_9aaa807b34203baf_015full.jpg
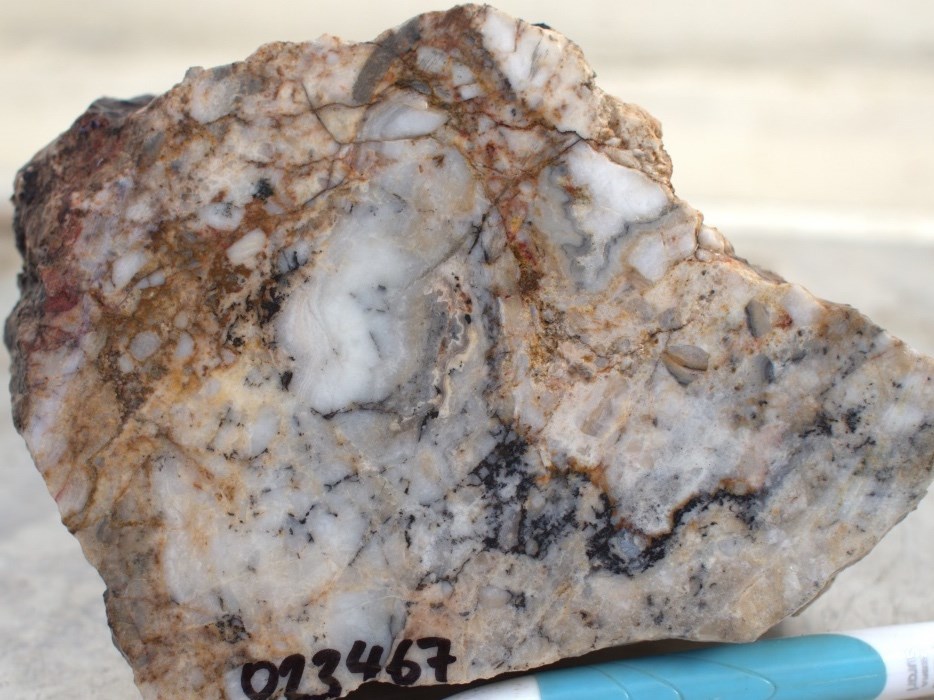
Plate 7: Hirochi Prospect, mine dump sample 023467, Ginguro banded quartz vein. Au 33.2 g/t & Ag 218 g/t
To view an enhanced version of this graphic, please visit:
https://orders.newsfilecorp.com/files/5665/81362_9aaa807b34203baf_018full.jpg
NB: Au Eq g/t is Gold Equivalent calculated using a gold price of USD$1,745 per ounce and a silver price of USD$25 per ounce
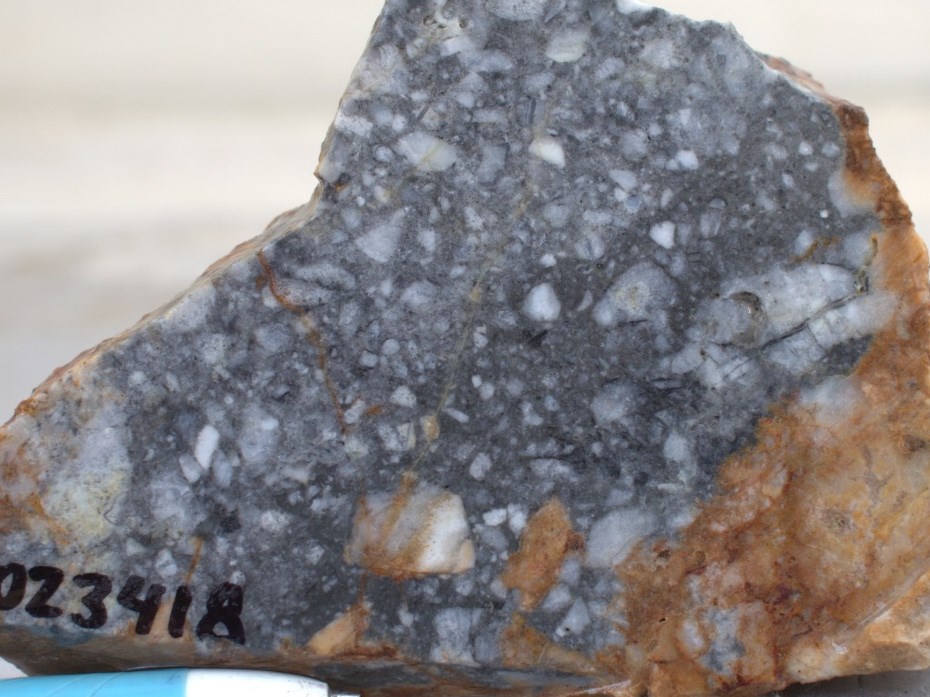
Plate 8: Hirochi Prospect, float sample 023418, Hydrothermal brecciated quartz vein. Au 6.5 g/t & Ag 167 g/t
To view an enhanced version of this graphic, please visit:
https://orders.newsfilecorp.com/files/5665/81362_9aaa807b34203baf_019full.jpg
![]()
To view the source version of this press release, please visit https://www.newsfilecorp.com/release/81362